
How to Check Your Data Before Spending Millions on User Acquisition?

Helping you stay 2.5 steps ahead of the games industry. Don't be too serious, except about UA.
Subscribe to my Brutally Honest newsletter!
To check your data before spending millions on user acquisition, it is essential to validate the accuracy and consistency of all tracked metrics across attribution platforms and app stores. Accurate data ensures that campaign performance is correctly attributed, enabling informed decision-making and effective resource allocation. For mobile game marketers, this includes maintaining data health by minimizing discrepancies, auditing essential metrics like installs, purchases, and revenue across channels, and conducting regular data health checks to align tracking systems. Running a data check campaign, starting with small-scale tests, ensures reliable tracking and campaign optimization before scaling. Comparing data between platforms, such as AppsFlyer and Google Play Console, allows for accurate validation of metrics. A well-executed UA data health check lays the foundation for efficient campaigns, enhancing algorithm performance and safeguarding investments in user acquisition.
How to Keep your Data Healthy?
To keep your data healthy, ensure accurate tracking and minimal discrepancies by regularly conducting data audits and health checks. Start with a small-scale campaign to verify tracking accuracy, and monitor discrepancies to stay within an acceptable range (around 5%). Use reliable analytics tools to identify and fix any issues promptly. Consistently maintain data hygiene by validating inputs, updating outdated information, and avoiding duplication. This practice ensures effective campaign evaluation, proper attribution, and optimal scaling of your user acquisition efforts.
Details Below:
Conduct Regular Data Health Checks
Periodically review your data tracking systems to identify discrepancies or gaps.
Ensure discrepancies remain within an acceptable range (e.g., 5%).
H3. Verify Data Tracking Accuracy
Use tools like Adjust, AppsFlyer, or Google Analytics to confirm correct tracking.
Run a small-scale data health check campaign to validate that data attribution is accurate.
H3. Eliminate Data Errors:
Check for duplicate entries, missing fields, or outdated information.
Correct any anomalies or inconsistencies in your datasets.
Optimize Campaign Algorithms
Ensure your data inputs align with campaign algorithms for accurate performance evaluation.
Test tracking across all platforms and channels.
Maintain Data Hygiene
Regularly update your databases to reflect current, accurate information.
Standardize data entry processes to avoid mismatches or errors.
Monitor Key Metrics
Continuously track important metrics like click-through rates (CTR), conversions, and discrepancies to identify and resolve issues.
Use Reliable Tools and Technologies
Invest in robust data tracking and analytics solutions to automate monitoring and reduce human error.
Train Your Team
Educate team members on best practices for data tracking and maintenance.
What is the Importance of Data Health Checks in User Acquisition Campaigns?
Importance of Data Health Checks in User Acquisition Campaigns is as followed:
If you’re running user acquisition marketing campaigns as a key component of your digital marketing strategy then you need to make sure your tracked data that will be used for evaluation and also campaign algorithms are correct enough. This is essential for being able to run campaigns effectively. A good, healthy data tracking (discrepancies roughly within the 5% range) can help ensure that your campaigns will be as successful as possible. Of course, you have to make sure each and every aspect of your campaign is as good as it can be, but it is a very good idea to start with a data health check before creating, launching, and scaling campaigns.
Before you start using this basic instructions suite, you’ll need to run a data health check campaign. Usually, it’s one campaign with a small amount of daily spending per channel, to ensure that you’ll get maximum results from your campaigns. Poor data tracking can attribute to poorly performing UA campaigns and insufficient UA scale as you are not able to evaluate campaign performance properly.
Why is a UA Data Health Check Necessary?
UA Data Health Check Necessary because it is best practice to keep your data in good condition. A well-kept data health will ensure that you have a data-driven approach and the game will be scaled more efficiently through UA. It consists of checking the infrastructure and comparing data through different sources which are used.
“Based on the initial test results, you
need to find out where the problems with data should be and bring ideas on how
to fix them.”
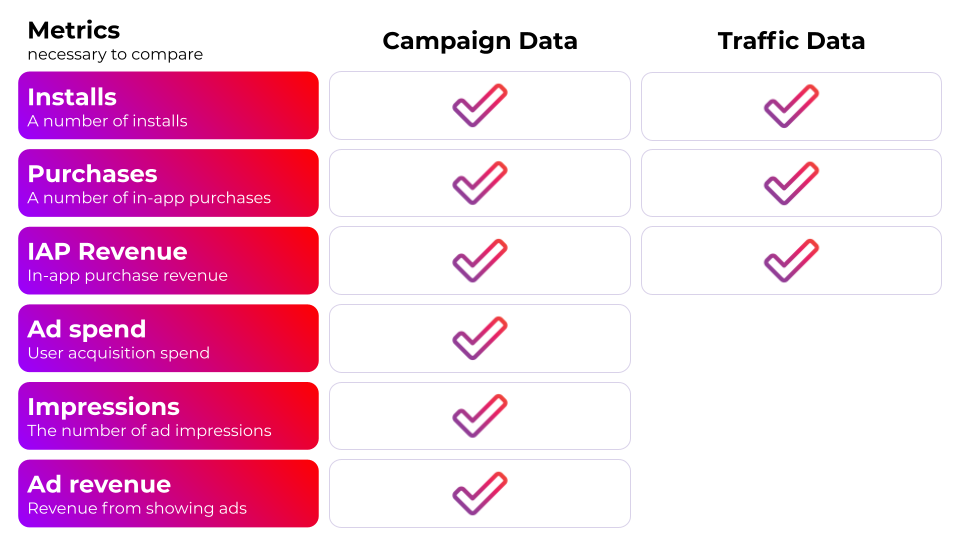
What are the Essential Metrics to Track Across Marketing Channels for Game User Acquisition?
Essential Metrics to Track Across Marketing Channels for Game User Acquisition are as followed:
Users arrive at your game through different marketing channels, including social networks (Facebook, Google UAC, Snapchat, TikTok, etc.), search (Apple Search Ads, Google Play Search, and Google Search), various video networks, various demand-side platforms, influencers, and traditional channels to some extent (TV, etc.). Having the right metrics in place is important but ensuring that you track them properly is even more important. Here are the necessary metrics that every developer and marketer should check before scaling.
What is an Example of Quick Data Check for Mobile Game UA?
To Conduct a Data Check Campaign and Optimize User Acquisition you need to do following things:
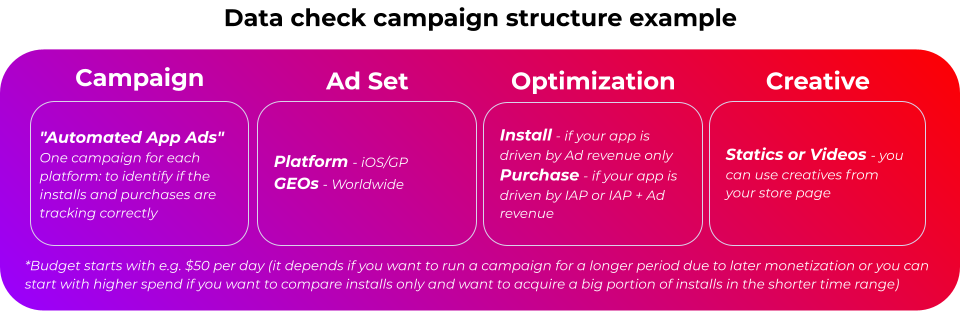
For our purposes, we use as an example data from the marketing channel Facebook, which we are going to compare with the attribution platform, in our case, it’s going to be Appsflyer.
So first of all, we need to prepare a data check campaign for each marketing channel that we would like to scale. In our case, it’s going to be Facebook. Secondly, you need to know if your app is driven by IAP or Ad revenue only or their combination (it’s crucial for campaign optimization). And last but not least, which countries are unlocked for each platform that you want to test.
“Pro advice on how you can kill two birds with one stone.”
Launch a worldwide campaign if possible and optimize based on events that you need to check. A worldwide campaign can help you identify TOP-countries during data check much earlier so you can immediately find out which countries make sense to scale more later on. Provided that the data after the test were correct.
After a few days of running a data check campaign, we can start with a data comparison between the marketing source (Facebook) and the mobile measurement partner (Appsflyer).
How to Compare Campaign Data Facebook and Attribution Platform?
To Compare Platform and Campaign Data for Accurate Analysis you need to do following things:
In this case, you need to compare the data per platform and campaign. Go to the Appsflyer Activity tab, select the period of time, when the data check campaign was live, and export – installs, purchases, purchase revenue, cost per platform for attributed traffic (cost is available only for Xpend clients) from Appsflyer. Extract the same daily campaign data from Facebook and compare the daily data and sum data between AF and FB, at the end of the day, overall values are most important.
You can also check daily Ad revenue per platform from Appsflyer (if the app is using In-app ads) and compare it with the same daily data from the Ad mediation platform.
Note: Regarding iOS14+ platform you need to check and compare installs also from SKAN Overview tab in Appsflyer. According to Appsflyer, the displayed data using the postback arrival date or by install date is derived using your measurement settings and postback arrival date. The install date is derived from the postback arrival time as follows: Postback arrival time-36 hours-[average last-active range]. The default [average last-active range] is 12 hours.
“Pro advice: you can compare daily data between MMP and Marketing channel, but this is possible only in marginal cases since Appsflyer Activity Tab shows data per activity date, while FB Ads Manager per cohort date. Don’t be stressed; overall values are most important.”
How to Validate Traffic data Stores and Attribution Platform?
To validate the comparison of campaign data, you should also compare all traffic data between the attribution platform and a specific store.
Go to the Appsflyer Activity tab, select the period of time, usually for the last 30 days, extract daily data – installs, purchases, and purchase revenue per platform for all traffic from Appsflyer. Extract the same data from a specific store and compare the data and sum data between AF and Store.
“Pro advice: In Google Play Console, instead of using .csv export use a copy-paste trick on charts to quickly copy data into spreadsheets. This will create a nice table with a daily revenue in google sheets. It is quicker than downloading the .csv report, and sometimes more reliable.”
Helping you stay 2.5 steps ahead of the games industry. Don't be too serious, except about UA.
Subscribe to my Brutally Honest newsletter!