
Appsflyer vs Singular – Performance index & Benchmarks comparison
The best answer to these questions is still the 4 am conference discussion with other people from the industry. But what to do if you are not at the conference right now?
Let’s look at the AppsFlyer Performance Index long-running industry report card that analyzes media network performance every half-year and compares it with Singular ROI index, but there are other interesting benchmark sections on both Appsflyer and Singular side. Appsflyer vs. Singular Benchmarks. It’s all here!
What is AppsFlyer Performance Index
AppsFlyer Performance Index, ranking the top media sources in mobile advertising for years. The rankings inside of the Index highlight the best media sources in mobile advertising and help marketers make decisions about how to spend their budgets.
Everybody in the report is thrilled to be ranked in AppsFlyer Index and thinks of it as the Oscar or Golden Globus for movies.
In the marketing industry, this index is crucial because it tells companies which media sources can deliver high-quality users from marketing campaigns. Because of this, many media sources want to rank at the top of the AppsFlyer Performance Index. If the media source makes it to the top ranks, it is evident to their target companies that they could deliver conversion to the advertisements they place on their websites or apps.
The 15th edition of the AppsFlyer Performance Index, which covered the first half of 2022 is the latest report. For this release, they studied 27 billion app installs, 500 media sources with at least 50,000 attributed installs, and 19,000 apps with installs of at least 3,000.
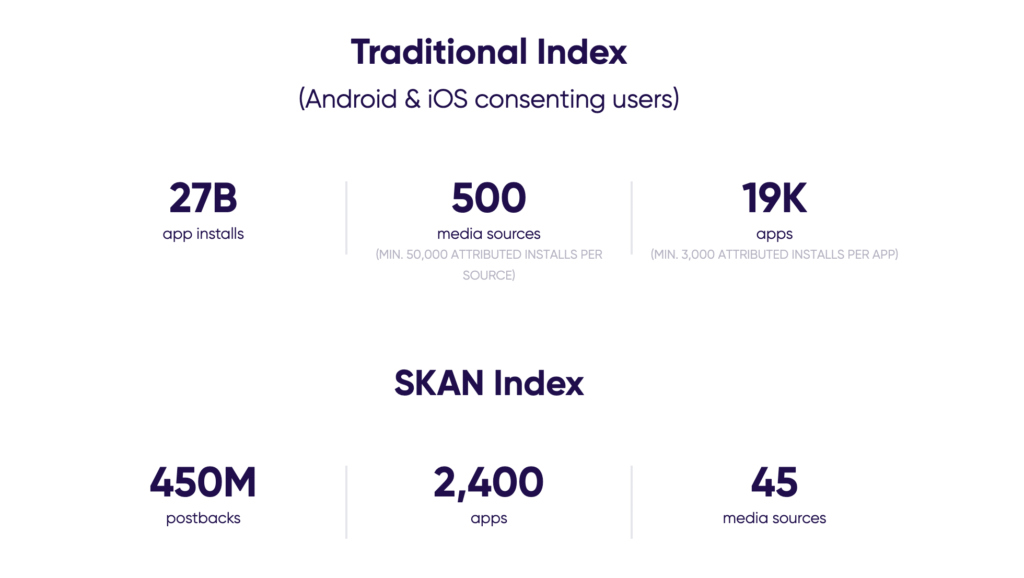
The last report delivers three indices to rank media sources: SKAN, Retention, and Remarketing. Each index has different classifications for ranking, including region, industry, categories, and operating systems.
The SKAN Index, which ranks media sources based on their ability to deliver users with a high chance of completing an in-app purchase (e.g., purchase, first-time deposit), in-app ads (e.g., ad view, ad click) and in-app engagement (e.g., registration, start trial) are the youngest.
In addition to ranking platforms, the AppsFlyer report delivers critical findings about the mobile app marketing landscape with insights on social network channels, Android vs. iOS scale, and more.
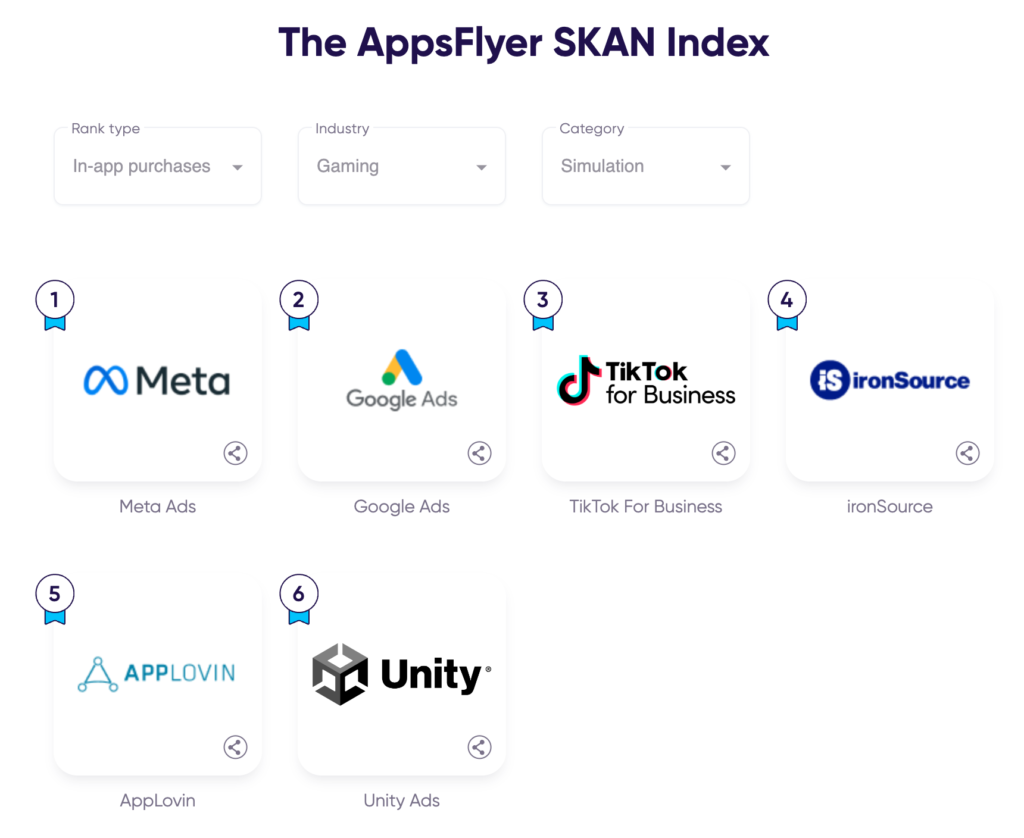
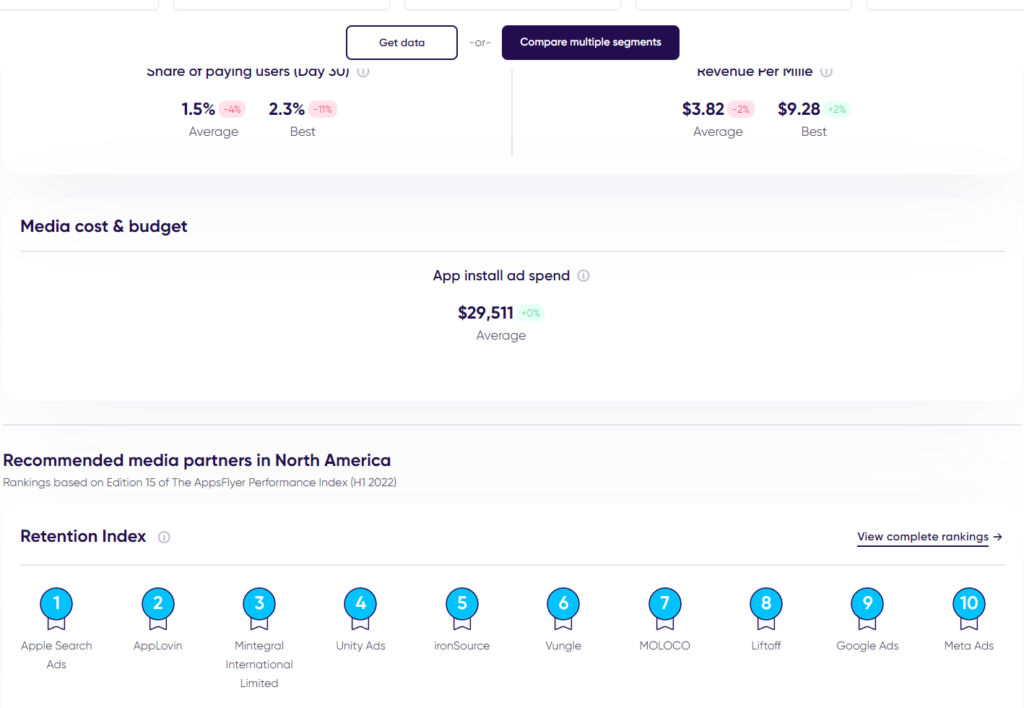
The AppsFlyer Performance Index from a UA perspective is mainly used when you want to scale your game. As a UA manager, I always check the data from the newest report when we open up new channels. In AF Index you can filter OS and game genre, and the report shows you data by selected power/volume.
Ex: I run campaigns for Simulation iOS mobile game on several networks Facebook, Unity, and Google Ads. We want to scale the game, but not at the cost of the longer payback window (currently 90d). So you can check the newest AF Index, filter your game category, and see there is room for opening new channels because TikTok is currently in third place IronSource in fourth (see screenshot) and you are not running any campaign there.
Keep in mind not every channel fits 100% of every game genre, so you need to run some test campaigns before the scale.
 Listen to no Bullshit gaming podcast two & a half gamers
- two & a half gamers session #51 – Live Special @ Gamesforum Barcelona
- two & a half gamers session #50 – Deep analysis of the current web3 market, implications & future
- two & a half gamers session #49 – How to leverage User Churn Prediction? Why is it important?
- two & a half gamers session #48 – Could Frozen City earn 80% more revenue? Full UA, Admon, GD review
- two & a half gamers session #47 – Creative trends 2023, 1 year anniversary – kudos to you
What is the Singular ROI index?
Singular was the first to publish a ranking of marketing partners by advertising ROI in 2017, and they continue to analyze the vast array of advertising choices marketers have in order to showcase the ones who do it best. This ROI Index is a summary of data from hundreds of ad networks, thousands of integrations, and over $10 billion in ad spend.
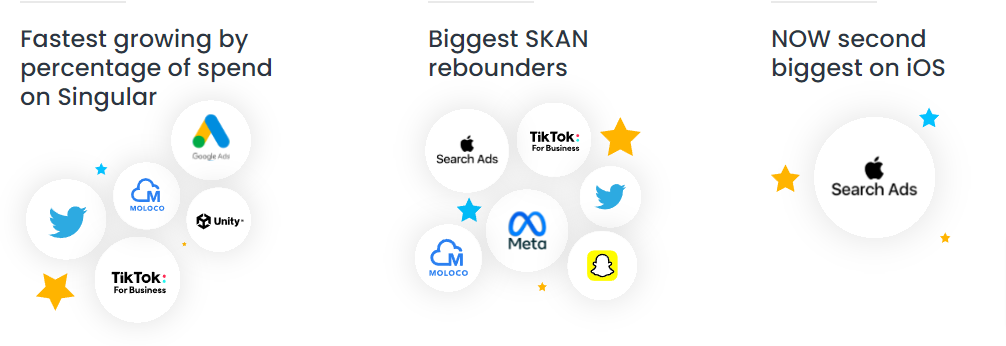
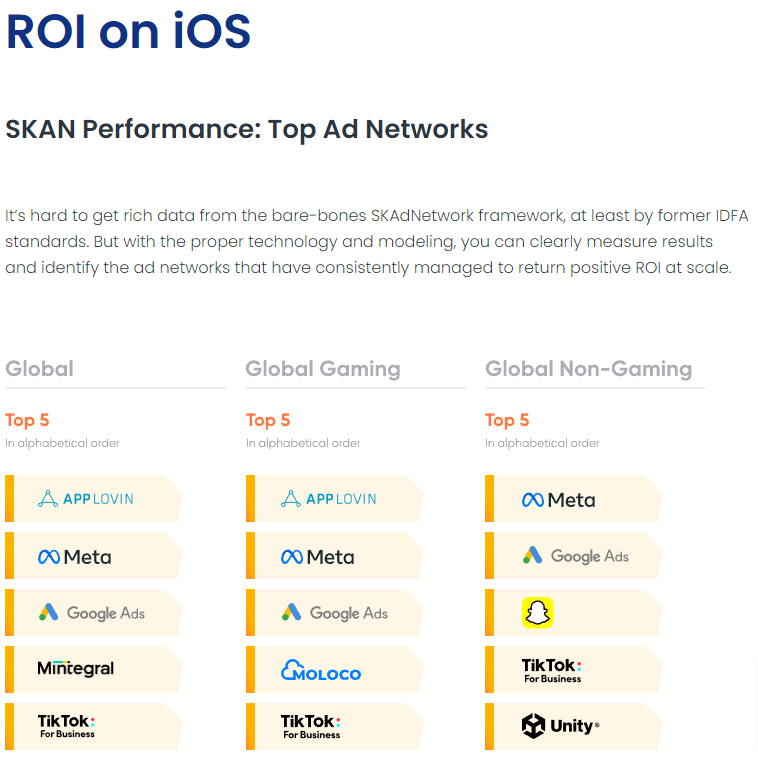
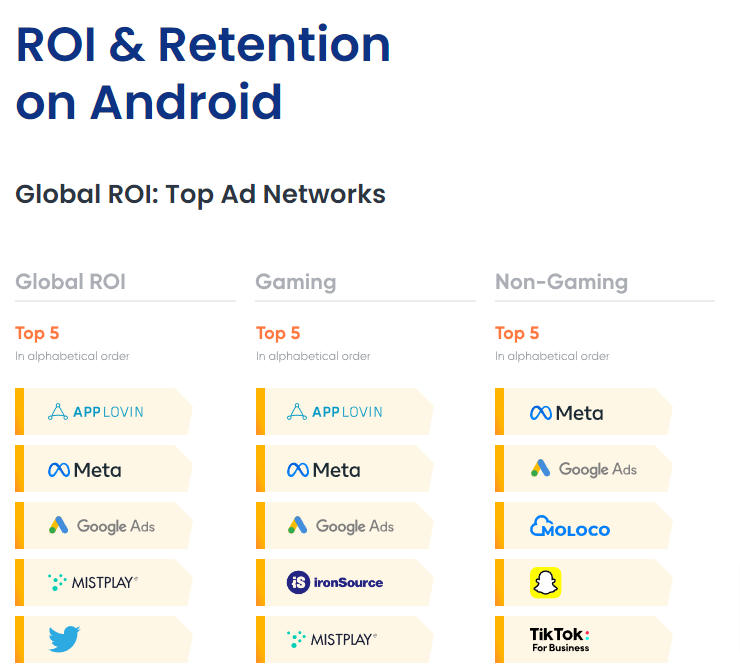
Fresh out of the oven ROI index 2023 shows us the top 5 networks across iOS & Android.
What is Appsflyer Benchmarks
Find out how your mobile app campaigns perform compared to your competitors with the Appsflyer benchmarking data.
The benchmarks are based on certain data processed by AppsFyer through its platform after it has been fully anonymized and aggregated. To ensure statistical validity, we follow strict volume thresholds and methodologies.
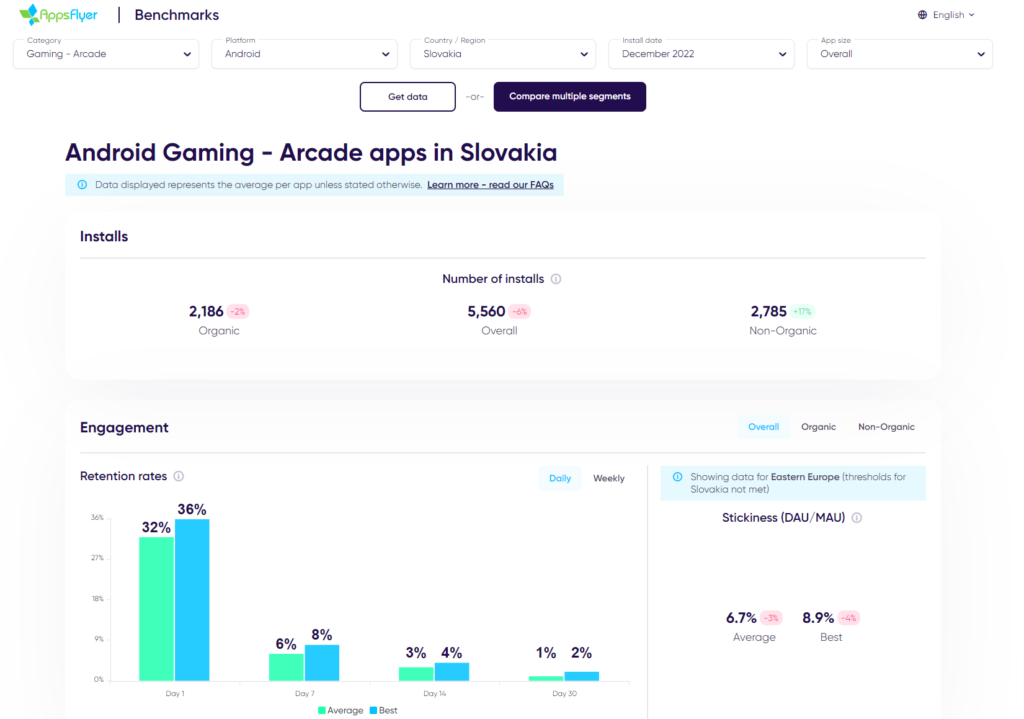
Every month the data is run, and the tool is updated. To the extent there is enough data to surpass the strict thresholds, then previously missing metrics may be available. You can select different gaming subcategories and check out revenues, CPIs and bunch of other shit.
What is Singular Benchmarks
Singular released its benchmark feature a few months ago and is it inside of Singular so the first bottleneck is the report is not free. According to Singular, this report provides various data visualizations that allow you to understand where your company is positioned in relation to your industry. You can also discover market trends and uncover opportunities in your ecosystem.
Singular, in comparison with AF Index uses data that covers the two latest calendar months, and does not include the current incomplete month.
Singular divides the Benchmarks into three main categories: Market Snapshot, Portfolio, and Networks Optimization report.
Market Snapshot Report
This report shows you which ad networks/platforms are the most popular in the market or a specific market segment. And you can filter the charts by vertical (in the AF index it is Category), country/region, and platform (Android or iOS).
Market snapshot including three different charts:
Current Market Share Chart
Year Over Year Change Chart
Organic Installs Volume vs. Paid Chart
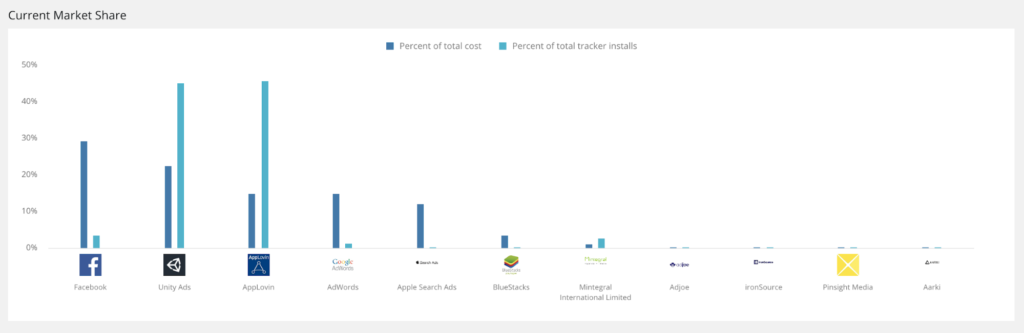
The Current Market Share chart get you a snapshot of the current state of the advertising market in your vertical/region. For instance, you can check that in the US market on Android for Match 3 Games most companies spend on Facebook. And this may help you to decide to use a similar channel for your Match 3 game since this info might indicate which networks are popular and which give the best results.
Keep in mind: Cost includes all the costs that Singular can pull. Singular does not filter specific campaign types (e.g. brand campaigns or retargeting campaigns). Installs include all the installs in your dataset, while re-engagements and installs that do not have cost are not included.
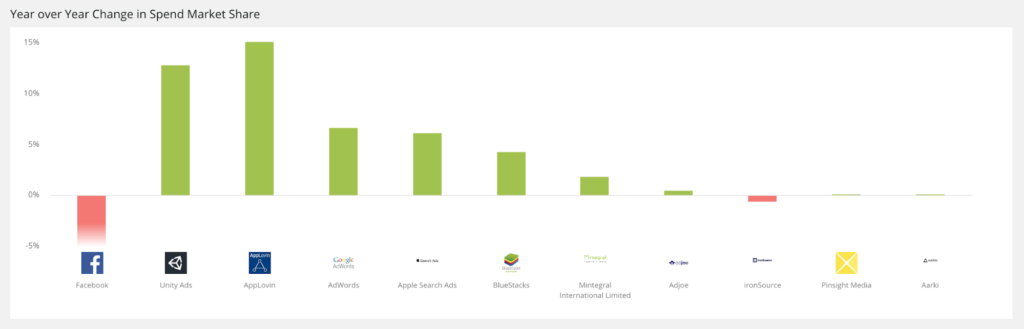
Year over Year change showing you the change in spend share for each ad network from the parallel two-month period last year. This overview may help you plan your spend strategy, and get an idea of which networks are getting stronger in your app/category/region and which are losing their hold on the market.
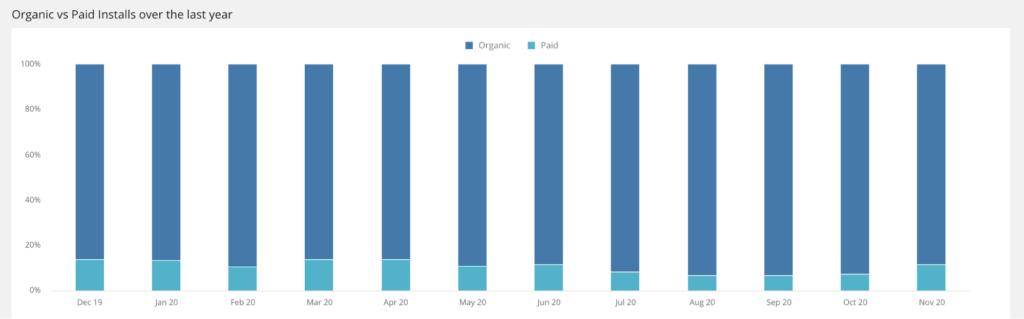
Organic Installs Volume vs. Paid Chart helps you estimate what you should expect from your organic installs, especially if you are entering a new region or app/game category.
Portfolio Report
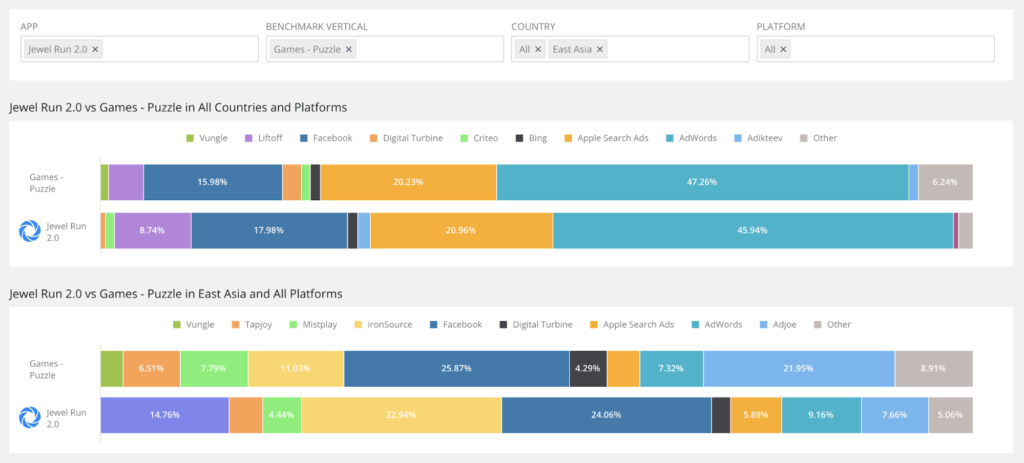
A portfolio report is the most interesting feature so you compare the way you divide the ad spend for one or more of your apps against the market behavior.
So you select your app and compare it with similar app/game categories, for specific countries, and platforms. You can find that most of your spend goes into Google Ads but for the Match 3 game category, other studios also use Unity Ads and Facebook. This info might indicate which other channels perform best in your category for selected counties.
Optionally, you can select more verticals, countries, and platforms to compare.
Ex: This overview is similar to the AF index where I as a UA manager can clearly see my spending divided by the channels I’m running, and compare it against a country or selected game genre. In contrast with AF Index the networks in Singular are not divided by power or volume rankings so this just indicates which other channels are running other companies in my category for selected counties last 60 days. In this case, the biggest advantage is freshes of data in favor of Singular.
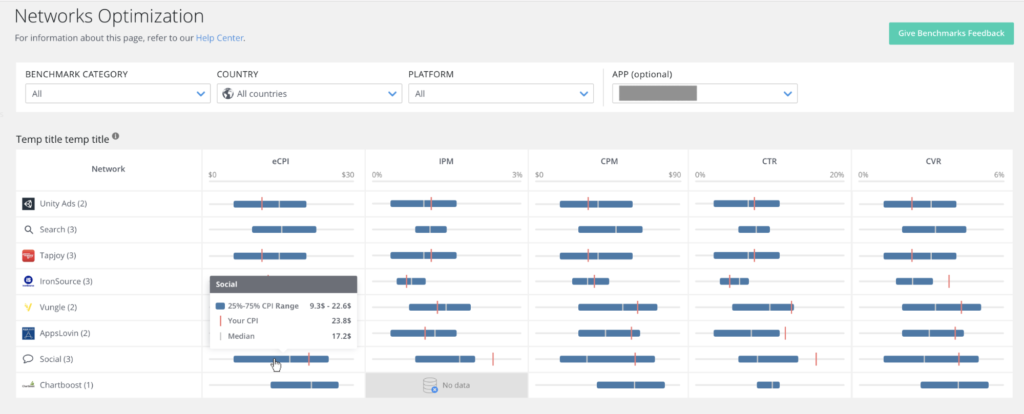
Network Optimization Report
At first sight, it looks like this report is killer and you’ve got info about CPIs, IPM … per network, country, and platform. Yes, you have but keep in mind you don’t know from which optimization the data are pulled.
Singular shows the 25-75 percentile of the values (within the Singular dataset) for each KPI so yeah you can assume the lowest CPI can be from install-optimized campaigns and the highest is close to ROAS/Value optimized campaigns. A similar approach you can choose for CTR where the highest numbers should be from Install campaigns and the lowest from ROAS/Value optimized campaigns. Another variable can be the creative type (static, video, playable ads, e.g.).
Anyway, this Network Optimization report is promising and if Singular would add a filter per campaign optimization and creative type it will be more useful.
Until it does check this ULTIMATE BENCHMARKS from video creatives only for top-performing Game Genres in 2022.
Conclusion
Since 2015, the AppsFlyer Performance Index is a prestigious industry benchmark, that helps recognize the industry leaders within mobile advertising, and mobile marketers make their most important decision: which media sources to partner with. Both reports are based on their own data from their clients.
The goal of these reports is to provide advertisers with accurate information about results. It does not make sense for companies to advertise on platforms where they do not get a conversion. At the end of the day, you only want to work with companies that help you drive the most value.
Appsflyer Performance Index
The biggest advantage of the Appsflyer Performance Index is that focuses on SKAN itself, which ranks media sources based on their ability to deliver users with a high chance of completing an in-app purchase, in-app ads, and in-app engagement. The same applies to the Retention Index. This section is particularly important for Gaming apps, as it drives more ad revenue thanks to more ad views.
The only disadvantage is, in my opinion, is semi-annual data study. What can drive the performance at the beginning of Q1 should have the same results in Q3.
Singular ROI index
Publishing the Singular ROI index since 2017, analyzing the vast amount of advertising choices marketers have in order to showcase the ones who do it best. This ROI Index is a summary of data from hundreds of ad networks, thousands of integrations, and over $10 billion in ad spend.
Interestingly enough, not getting the same results as AF index, but there is an overlap of networks.
Appsflyer Benchmarks
This is available to everyone and that’s how it actually looks like. When compared with the data I see for games I manage, it was way different. But! They have data across the board and really large data set. This definitely is a refreshing tool since the times of Chartboost CPI index.
Singular Benchmarks
On the other hand data, freshness is Singular’s biggest advantage as he takes data from the two latest calendar months. The report is much more about the market share than the network performance. As Singular does not filter specific campaign types for the cost data you can’t exactly say if the network with the highest market share also performing the best. However, you can still compare the results from the report with the AF benchmarks as it’s free, unlike Singulars Benchmarks.
Anything I missed?
Please share this article with your industry friends. It would mean a world to me.
Also, subscribe to my newsletter. It’s so honest it might actually annoy you. If you are easily annoyed, please don’t subscribe.
Facebook
Twitter
LinkedIn
Subscribe now to podcast